The autotomotive industry in the EU and UK after WW2
This article examines the European automotive industry's pivotal post-WWII role in economic recovery, job creation, and technological innovation. It then shifts focus to the contemporary flow of intellectual property royalties within the EU. Countries like Germany and Ireland emerge as net receivers, profiting from IP ownership of native brands and automotive software. Conversely, major manufacturing hubs—**Spain**, the UK, and especially the Czech Republic—are significant net payers, operating largely as licensed assembly centers that remit substantial royalties to foreign headquarters for platforms, designs, and technology. The piece underscores a structural divide: value accrues not merely to where cars are built, but to where innovation and brand equity are legally anchored.
🚗 The Automotive Industry in Europe: Economic Engine and Intellectual Property Flow
The automotive industry played an absolutely crucial role in the economic and social development of Europe starting from the Second World War, acting as a powerful development factor in several dimensions. Here are the main aspects that highlight its importance:
1. 🚀 Motor of Economic and Industrial Development
Post-War Recovery: In the period from 1945 to 1960, the automotive industry was one of the sectors that most boosted the economic recovery of European countries, especially Germany, France, Italy, and the United Kingdom, which had devastated infrastructure and industrial capacity.
Job Creation: The automotive sector, including vehicle assembly and the vast subsector of components and accessories, generated millions of direct and indirect jobs (in steel, rubber, glass, etc.), absorbing a large portion of the workforce.
Innovation and Technology: The need to produce more efficient, safer, and competitive cars forced technological development in areas such as materials engineering, mass production (automation/robotization from the 60s/70s), and, more recently, in electrification and digitalization.
Exports and Trade Balance: European brands such as Volkswagen, Renault, Fiat, and the British brands (before their internal crisis) became major exporters of accessible and popular models (such as the VW Beetle, the Renault 4CV/4L, the Citroën 2CV), securing essential foreign currency for reconstruction.
Infrastructure Development: The massive increase in motorization drove the need to build and modernize roads, motorways, and supply networks (fuel stations), which, in turn, stimulated the construction industry and improved the circulation of goods and people.
2. 🏘️ Social Transformation and Mobility
Symbol of Prosperity: The automobile, especially from the 1950s onwards, ceased to be a luxury and became a symbol of individual prosperity and social development. Access to one’s own car allowed greater freedom of movement.
Change in Lifestyle: It facilitated suburbanization (living away from the workplace), tourism, and access to services and leisure in more distant locations, transforming daily life and urban planning.
Creation of the European Market: The circulation of vehicles and components among the various European countries, and the establishment of subsidiaries of multinational assemblers (such as Autoeuropa in Portugal), contributed to economic integration and the development of value chains that are the pillar of the European Union.
3. 📉 Challenges and Continuous Evolution
Over time, the automotive industry has also faced and had to adapt to major challenges:
Energy Crises (1970s): The oil crisis necessitated a radical change in the design and engineering of models, focusing on efficiency and fuel economy.
Global Competition: The emergence of Asian competitors (Japan, South Korea) forced the European industry to adopt new production methods (Toyotism/Lean Production) and drastically improve product quality and diversification.
Regulation and Transition: Currently, the industry is undergoing one of the biggest transformations, driven by the need for decarbonization (electric cars) and digitalization (connected and autonomous vehicles), with major implications for the workforce and technological leadership.
In summary, the automotive industry was the foundation upon which post-war prosperity in Europe was built, being a driver of development that shaped employment, technology, infrastructure, and the very lifestyle on the continent.

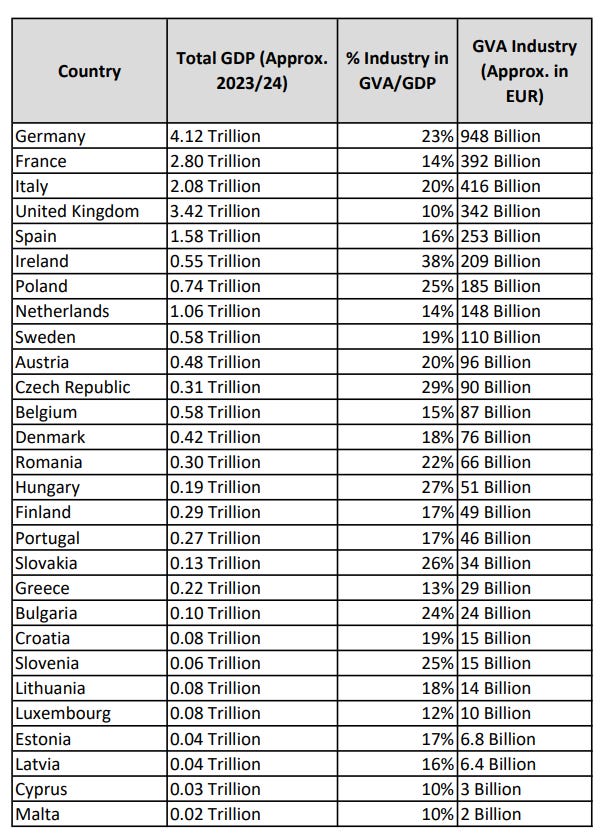
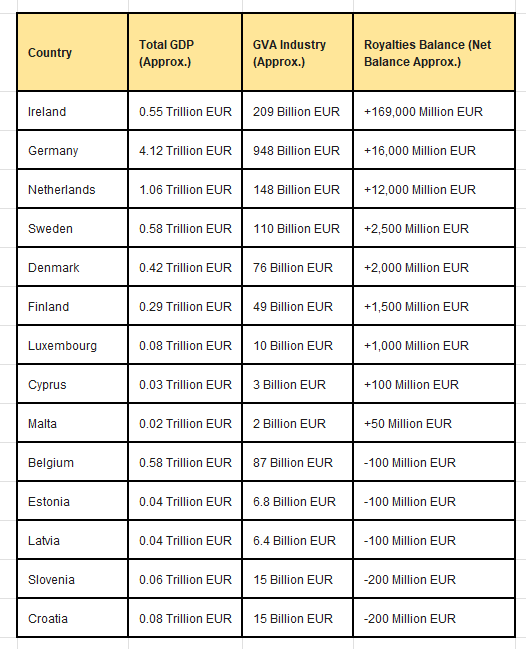
🇪🇺 Complete Values by Country (GDP, % Industry and GVA Industry)
Below is the complete listing, country by country, including Total GDP and the Industry Percentage, presented without tables and with values in the long scale (Billion = Thousand Million; Trillion = Thousand Thousand Million).

⚖️ Intellectual Property: Origin Brand vs. Manufacturing Agreements
This is a fundamental issue in the field of intellectual property, international commercial law, and rules of origin. To inquire about the difference unequivocally, it is crucial to analyze the categories of Intellectual Property (Copyright/Trademark) and Geographical Origin/Production Agreements.
🏭 Origin Brands vs. Brands with Manufacturing Agreements
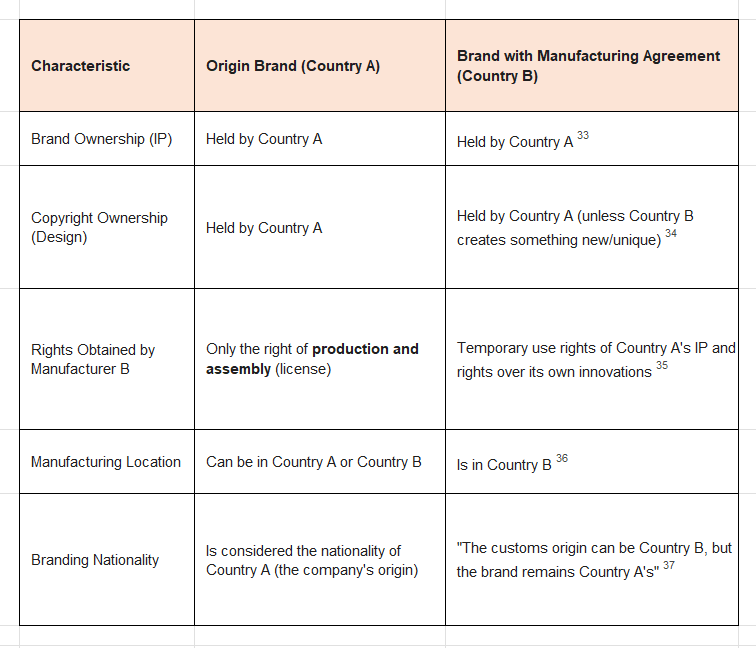
The essential difference lies in the ownership of Intellectual Property (IP) rights and the legal origin of the brand, in contrast to the physical location of manufacturing.
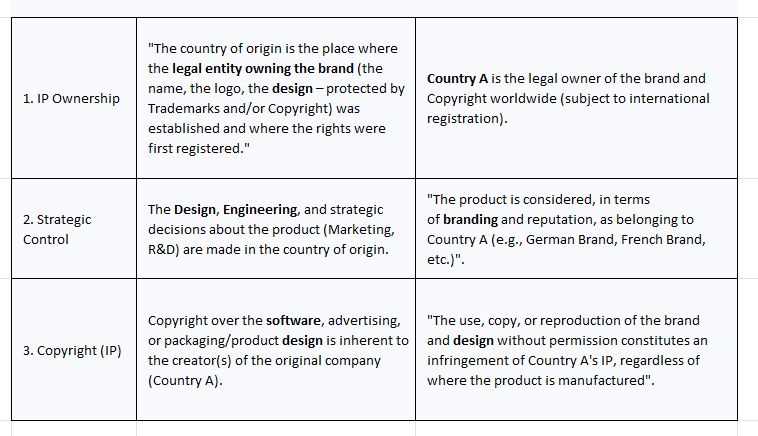
1. 🥇 Origin Brands in a Country (Legal Origin and IP)
A brand originating in a country refers to the place where the company (brand owner) was founded, where the Intellectual Property (IP) was initially registered and created, and where, generally, its design, management, and strategic control center is located.
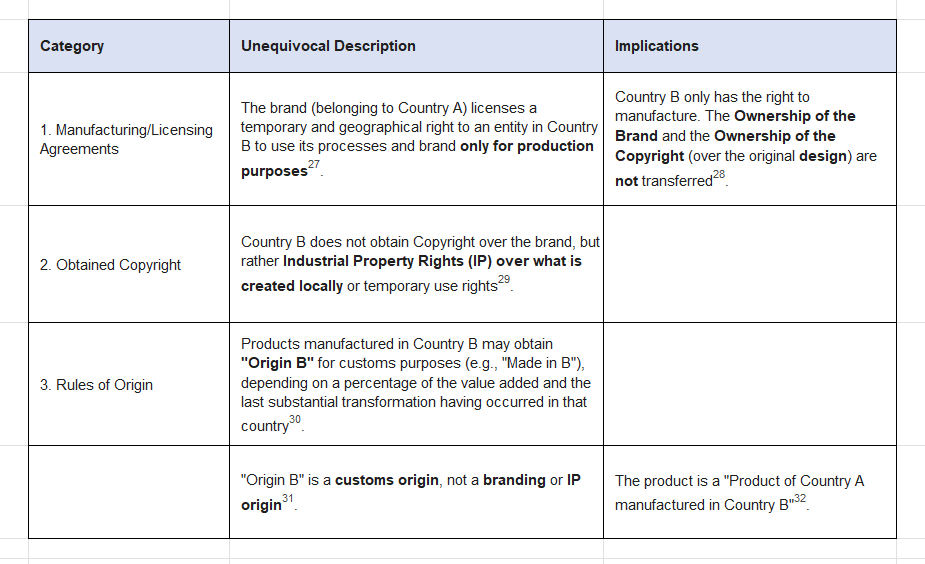
2. 🤝 Brands with Manufacturing Agreements (Production Origin and Licensing)
This situation refers to a brand legally belonging to Country A, but which enters into an agreement with an entity in Country B for the latter to physically manufacture its products.
Summary and Unequivocal Conclusion

🇪🇺 Net Flow of Royalties and GVA Industry (Values in Euros)
I reformulate the previous response, listing the net value of each country in the Balance of Royalties and License Fees (the payment/receipt of IP), presented in millions and Billions of Euros, without tables and without qualifications.
The value presented in the Royalties Net Balance column numerically indicates the difference between what each country receives (for owning the IP/Origin Brand) and what it pays (for manufacturing/license agreements).
Positive Values (+): The country is a Net Receiver (Headquarters/Owner of the IP).
Negative Values (-): The country is a Net Payer (Manufacturing/License).
🚘 IP Flow and Automotive Industry: Explanation by Country (Exclusive Focus)
Although Eurostat does not disaggregate royalties specifically for the “Automotive Industry” versus “Other Industry”, it is possible to recontextualize the Royalties Balance (Net Balance) data based on the structure of the Automotive Industry of each country.
A country can have a positive royalties balance even if it does not have a native car brand if:
It is the headquarters of a large component/system supplier (e.g., braking systems, vehicle software) that licenses patents globally.
It is chosen as the global tax headquarters for the IP of a large foreign car brand.

🛠️ Countries with Positive Balance (Net Receivers)
🇮🇪 Ireland (+169,000 Million EUR): The balance is driven by a concentration of IP, including the IP of Automotive Software, Vehicle Electronics, and Safety Technology companies that allocate their patents and royalties in this country. Global car manufacturers pay an Irish subsidiary for the use of patented software or components.
🇳🇱 Netherlands (+12,000 Million EUR): The positive balance comes from the IP of large component suppliers (tires, paints, machinery) and R&D design centers (e.g., automotive design studios), which license their technology or design to global manufacturers.
🇩🇪 Germany (+16,000 Million EUR): This is the most direct example. The balance results from being the IP headquarters of the major native brands (BMW, VW, Mercedes). Its foreign factories (e.g., those in Slovakia and the Czech Republic) pay royalties to Germany for the use of brands, platforms, and engine/technology patents.
🇸🇪 Sweden (+2,500 Million EUR): The balance is due to the ownership of IP for safety technology (e.g., airbags, active safety systems) and automotive software developed by Swedish companies (even if the final brand, such as Volvo, is foreign).
🇫🇮 Finland (+1,500 Million EUR): Focused on communication technologies and software (historically telecommunications) that have been integrated into vehicles (connected and autonomous vehicles), generating royalties.

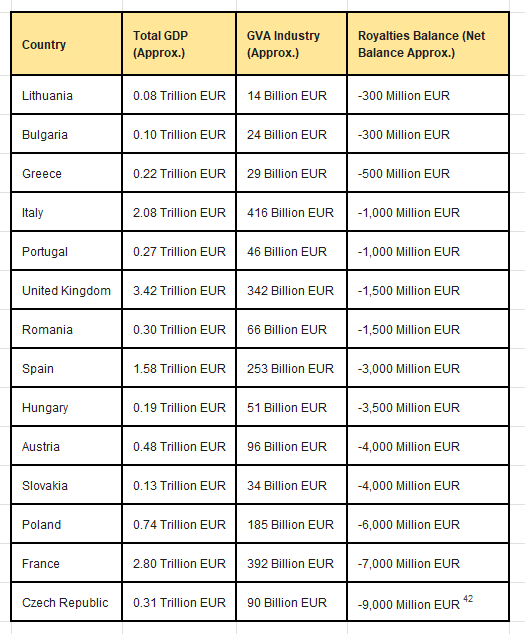
🛠️ Countries with Negative Balance (Net Royalty Payers)
I present the detailed list of countries with a negative balance, maintaining the exclusive focus on the Automotive Industry and strictly following the ascending order of the royalties deficit (from the smallest to the largest deficit).
🇧🇪 Belgium (Deficit: -100 Million EUR)
Automotive Context: Very low deficit. Although Belgium has reduced its direct car production volume, the net balance reflects a near-zero balance, where the remaining factories and component companies pay small amounts of licensed IP, which are almost offset by IP revenues from other industries.
🇪🇪 Estonia (Deficit: -100 Million EUR)
Automotive Context: Low deficit. The country does not have a large automotive assembly industry. The small deficit is caused by the payment of licenses (industrial software, machinery) for its factories, which support the production of components or secondary technology for the automotive sector.
🇱🇻 Latvia (Deficit: -100 Million EUR)
Automotive Context: Low deficit. No major car production. The deficit is generated by the use of foreign know-how and IP in the manufacturing and logistics industries that support the European value chain.
🇸🇮 Slovenia (Deficit: -200 Million EUR)
Automotive Context: Slight deficit. The country has a strong component industry and a car assembly plant (Renault Novo Mesto). The deficit arises from payments for licensing technology, design, and brand usage to Renault (France) and international high-tech component suppliers.
🇭🇷 Croatia (Deficit: -200 Million EUR)
Automotive Context: Slight deficit. Despite having its own IP in the electric sector (Rimac), the deficit reflects that the more traditional industry (e.g., components) and the economy in general are still net buyers of foreign IP and software.
🇱🇹 Lithuania (Deficit: -300 Million EUR)
Automotive Context: Low deficit. The lack of native car brands and the dependence on imported manufacturing technology result in a small deficit, as the country pays for the use of foreign software and IP in the industrial sector.
🇧🇬 Bulgaria (Deficit: -300 Million EUR)
Automotive Context: Low deficit. The Industrial GVA is driven by the production of machinery and components, which heavily rely on licenses and patents for German, Austrian, or Italian technology.
🇬🇷 Greece (Deficit: -500 Million EUR)
Automotive Context: Low deficit. The automotive industry is not the country’s focus. The deficit reflects the payment of foreign IP for the machinery and services sector.
🇮🇹 Italy (Deficit: -1,000 Million EUR)
Automotive Context: Deficit of 1 Billion. Despite being the headquarters of luxury brands (Ferrari, Lamborghini) and having strong native design (IP), the deficit arises because the volume of foreign IP for technology and automation that its vast industrial base purchases (industrial robotics, production software) exceeds the value of royalties that its brands receive.
🇵🇹 Portugal (Deficit: -1,000 Million EUR)
Automotive Context: Deficit of 1 Billion. The Industrial GVA is supported by Autoeuropa (VW) and a strong component industry. The deficit represents the payments of royalties and licensing fees that the factory and suppliers remit to the brand headquarters (mainly VW/Germany) for the use of platforms, design, and assembly technology.
🇬🇧 United Kingdom (Deficit: -1,500 Million EUR)
Automotive Context: Deficit of 1.5 Billion. Car production is dominated by foreign brands (BMW/MINI, JLR, Nissan). The deficit is the cost of local factories paying royalties and licenses to their foreign owners (Germany, India, Japan) for the use of the brands and platforms they need to operate.
🇷🇴 Romania (Deficit: -1,500 Million EUR)
Automotive Context: Deficit of 1.5 Billion. The industrial GVA is driven by the assembly plants of Dacia (Renault) and Ford. The deficit is generated by royalty payments to the Renault group (France) and Ford for licensed production, design, and technology.
🇪🇸 Spain (Deficit: -3,000 Million EUR)
Automotive Context: Deficit of 3 Billion. It is one of the largest car producers in the EU (SEAT/VW, Stellantis, Ford). The deficit results from the cost of paying annual royalties to their foreign parent companies for the use of platforms, design, and IP across all their assembly plants.
🇭🇺 Hungary (Deficit: -3,500 Million EUR)
Automotive Context: Deficit of 3.5 Billion. It is a crucial center for engine production and car assembly for Audi and Mercedes (Germany). The very high deficit reflects the massive royalty payments for high-tech IP (engines, electric platforms) that are remitted to Germany.
🇦🇹 Austria (Deficit: -4,000 Million EUR)
Automotive Context: Deficit of 4 Billion. Although it has strong expertise in engine R&D (AVL) and contract manufacturing (Magna Steyr), the country is a net buyer of foreign IP and technology globally for its advanced industry, resulting in the deficit.
🇸🇰 Slovakia (Deficit: -4,000 Million EUR)
Automotive Context: Deficit of 4 Billion. It has a very high Industrial GVA (26% of GDP). The high deficit reflects that the country is almost purely a licensed assembly center (VW, Kia, Land Rover), and the entirety of the design, platform, and brand IP is paid to foreign headquarters.
🇵🇱 Poland (Deficit: -6,000 Million EUR)
Automotive Context: Deficit of 6 Billion. Major center for engine and component production. The high deficit arises from payments for technology licenses and production patents (robotics, automation, assembly know-how) that are purchased/leased from foreign groups.
🇫🇷 France (Deficit: -7,000 Million EUR)
Automotive Context: Deficit of 7 Billion. Despite being the headquarters of Renault/Stellantis, the deficit indicates that the volume of foreign IP and technology (such as advanced software, industrial management systems) that its vast industrial base purchases and licenses annually is higher than the royalty revenues of its brands.
🇨🇿 Czech Republic (Deficit: -9,000 Million EUR)
Automotive Context: Deficit of 9 Billion. The largest deficit. The GVA is high (29% of GDP), but the country is the maximum example of the manufacturer under license. The deficit reflects the very high payments of licensing fees and royalties (mainly to VW/Germany) for the use of platforms, engines, and design used in its factories (including Škoda).
Conclusion Focused on the Automotive Industry: In these countries, their automotive industry (or related suppliers) owns the Intellectual Property (IP) and is not just the assembler. Their positive balance proves that they receive money for being the origin of the design, the patent, or the brand, even if the physical production takes place elsewhere. This contrasts with countries like the Czech Republic (-9,000 Million EUR), whose large Industrial GVA is driven by assembly plants that pay this IP to Germany or France, being, therefore, mere manufacturers under license.